Dashboarding

What are Dashboards?

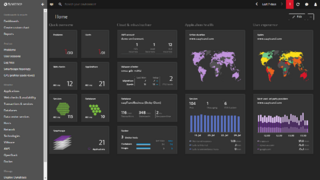
Dashboards provide quick, focused access to data you are monitoring in your environment. You can create, configure and position different charts and tiles to meet your specific needs. While Dynatrace provides many preconfigured tiles, there are also several configurable tiles that you can customize to visualize the metrics that are most relevant to those viewing the dashboard.

Dynatrace has recently released a new dashboard platform. To learn more about this new dashboard feature, visit this documentation.

Useful Links

Options/Features

Dashboarding Provides:
  • Access to tiles and charts, which can have their own settings for timeframe, management zone, and sharing
  • Ability to make different dashboards for specific people, roles, and teams, so everyone can focus on what’s important to them
  • Ability to subscribe to dashboard reports
  • Management through the Dashboards API

Setup and Configuration

Configuration

Create a dashboard:
  1. Select Dashboards from the navigation menu
    • This will be under the Observe and explore dropdown
  2. Select Create Dashboard in the top of the dashboards table
  3. Enter a Dashboard name and select Create
    • This new dashboard will open in edit mode, meaning you can add, edit and delete tiles
TIP New dashboards are private and viewable only by yourself until explicitly shared. See ‘Sharing Dashboards’ section below for assistance.
Clone an existing dashboard

When you only have viewing permissions, you cannot customize or share the dashboard. You can clone them to  then modify and share. This means you can clone someone else’s dashboard to save your own work, or even clone a preset dashboard to start with something more elaborate.

  1. Select Dashboards from the navigation menu
  2. Find the dashboard you want to clone (Use filters to narrow results)
  3. On the dashboard you want to clone, select the three dots () button, and then select Clone
  4. The clone of the dashboard will open in edit mode
  5. From here, you can edit the cloned dashboard
Create a preset dashboard

*Requires Admin access

Make sure presets are enabled by going to Settings > Dashboards > Preset settings and turning on Enable presets

  1. Create or open an existing dashboard
  2. Select Edit
  3. Go to the Settings tab and click Advanced settings
  4. On the Manage access tab, turn on Publish as preset
  5. Click Save changes

To verify the change

  1. Go to Dashboards
  2. Filter by Preset: Yes
  3. Make sure the dashboard is displayed in the table

Usage

Navigation:
  1. Select Dashboards from the navigation menu to view all dashboards available to you
  2. Select any dashboard in the list to open it
    • When open, this is your current dashboard
  • For health tiles (Host health, Service health and Application health), hover over any red elements to identify them (such as hosts, services or applications).
  • To drill down a red element, select the red hexagon and select the View button
  • Green (healthy) elements cannot be drilled down – for more details, select the menu in the upper-right corner of the tile and select View details.
  • To return to the dashboard from the drill down, select the dashboard button in the upper-left corner of the Dynatrace web UI (this will return you to your current dashboard)
  •  Several dashboards can be opened at the same time in multiple browser tabs
Edit a dashboard
  1. Display the dashboard you want to edit
  2. Select Edit to open the Edit dashboard pane
  3. Use the Tiles tab to edit the content of your dashboard
    • When you edit a tile, changes are reflected instantly on the dashboard
  4. Use the Settings tab to change the dashboard’s timeframe or management zone, and to change report subscription settings
Add a tile
  1. Display the dashboard and select Edit
  2. Browse the Tiles tab of the Edit dashboard pane to find the tile you want to add
  3. Drag the tile and drop it onto an open spot on your dashboard
    • Tile configuration settings will be displayed automatically
  4. Configure the new tile and select Done to save your changes
Edit a tile
  1. Display the dashboard
  2. Hover over the tile and select the tile menu in the upper-right corner
  3. Select Edit tile
  4. Change configurations as needed
    • Watch the tile as you edit, as configuration changes are reflected in real time
  5. When finished, select Done to save tile changes and Done again to save the dashboard changes
Delete a tile
  1. Display the dashboard and select Edit
    • The Edit dashboard pane will be displayed
  2. Select the tile and then select Delete
  3. Confirm the deletion
Delete a dashboard
  1. Select Dashboards from the navigation menu
  2. Find the dashboard you want to delete
  3. Select the three dots () button 
  4. Select Delete
  5. Confirm the deletion
Add filters to a dashboard
  1. Select Dashboards from the navigation menu
  2. Select the name of your dashboard
  3. Select Edit
  4. Select the Settings tab and then select Advanced settings
  5. On the Dynamic filters tab, select Add filter
  6. Select a filter from the filter criteria list
  7. Repeat step 6 for each filter you want added
  8. Select Save changes

Filters that require additional input:

  • Application tag key
  • Host tag key
  • Process group instance tag key
  • Process group tag key
  • Service tag key

Now these filters are optional when you display the dashboard

  1. Display the dashboard
  2. Click in the filter bar and select a filter and value 

For examples, see the following page: Add dynamic filters to a Dynatrace dashboard | Dynatrace Docs

Filters on the dashboard table

You can filter the long list of dashboards on the Dashboards page to organize dashboards and find what you’re looking for.

  1. You can add filters directly by typing in the Filter by line above the table
  2. You can select a filter on the collapsible pane to the left of the table (These include Ownership, Favorite, Owner, Tag, and Preset)
  3. For more details on how to filter, see Organize Dynatrace dashboards | Dynatrace Docs

Dashboard reports are disabled by default. To enable them:

  1. Display the dashboard
  2. Select Edit
  3. Select Settings
  4. Set Enable reports to enable or disable

To subscribe to reports:

  1. Display the dashboard
  2. Select the three dots () button and select Subscribe
    • ​If you don’t have edit permission, you must ask someone with edit permission to enable reports, or you can clone the dashboard and subscribe
  3. Select how often you want to receive a report via email 
Sharing dashboards
  1. Go to Dashboards and then display the dashboard you want to share
  2. Select the three dots () in the upper-right corner of the dashboard
  3. Select Share
  4. Select Advanced settings to open the Dashboard settings to the Manage access tab
  5. Turn on Share dashboard and specify the sharing details
  6. Select Save changes

Click each link below for different sharing options
FAQ

Can I share a dashboard with someone who doesn’t have access to the related environment, or even Dynatrace in general?

  • Yes, you can configure global dashboard sharing settings
  • Go to Settings > Dashboards > General settings
  • Turn on Enable public sharing
  • For creating a shareable link, see the following link: Share Dynatrace dashboards | Dynatrace Docs

How can I assign a home dashboard?

  • With admin privileges, you can assign a preset dashboard as the home dashboard for a user group
  • Go to Settings > Dashboards > General settings
  • Select Configure home dashboard
  • Set User group to the corresponding group
  • Set Home dashboard to one of the preset dashboards on the list
  • Select Save changes

Can I favorite a dashboard that isn’t mine?

  • Yes! On the Dashboards page, select the gray star next to any dashboard you would like to favorite
  • Once favorited, it will appear at the top of the list