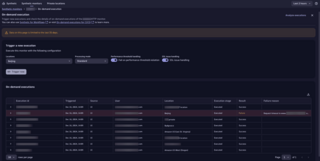
HTTP monitors reporting results

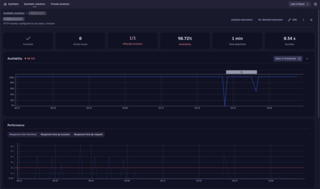
The HTTP Monitors Reporting Results page offers a comprehensive overview of monitor execution results, including visualizations and key monitor properties. The details panel provides quick insights through graphs and summaries, along with direct links and filters that allow users to explore problem details and adjust monitor settings efficiently.

screenshot of HTTP monitors reporting results

HTTP monitors reporting results

To access the HTTP monitors reporting results page,

  1. Go to Synthetic Synthetic (new).
  2. optional Select HTTP on the left to filter the list for HTTP monitors.
  3. From the list of HTTP monitors, select the monitor you want to examine.
  4. Select View details from the preview panel to access the details page.
screenshot of HTTP monitors reporting results

Metric visualizations

The top panel shows overall monitor availability and performance infographics for the selected timeframe.

Use the filter bar at the top of the page to filter all HTTP details by one or more locations.

In the upper-right corner of the page, you can access Analyze executions, On-demand execution, and more HTTP monitor settings:

  • Edit
  • for more options ( Disable and Delete)
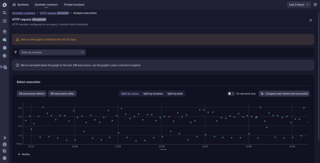
screenshot of Analyze Executions

The Analyze Executions feature in HTTP Monitors provides insights into execution results using a scatter plot chart. It allows users to navigate through executions and analyze them based on different dimensions.

Key Features:

  • Execution Selection: Users can move the view window to the next or previous 50 executions, with a maximum of 100 points displayed for readability.
  • Filtering & Grouping Options:
    • Split by Status: Default view showing Healthy and Failed executions separately. Users can focus on specific statuses using the legend.
    • Split by Location: Displays execution results from different locations, with the option to filter specific locations.
    • Split by Both: Combines status and location filters for a more detailed breakdown.

If multiple statuses exist for a location, they will be presented separately in the legend (e.g., Las Vegas (Healthy) and Las Vegas (Failed)).
screenshot of On-demand executions

On-Demand Executions

The On-Demand Execution feature allows users to manually trigger executions for HTTP monitors, independent of scheduled runs. This helps in validating new software versions and troubleshooting performance issues.

How to Trigger an On-Demand Execution

  1. Navigate to the monitor’s details page and select On-demand execution at the top.
  2. On the On-demand execution page, choose one or more locations from the Locations dropdown. You can select:
    • Locations assigned to the test in its definition.
    • Other locations that are not pre-defined in the test.
  3. Choose a Processing Mode (applies to all selected locations):
    • Standard (Default) – Contributes to problem detection, availability, and performance statistics. Results can be analyzed later.
    • Disable problem detection – Affects availability and performance statistics but does not trigger problem detection.
    • Execution details only – Does not impact availability, performance statistics, or problem detection, but results are still accessible.

All on-demand executions are recorded in the on-demand executions list in the web UI and are retrievable via API.

Additional Settings

  • Fail on Performance Threshold Violation:
    • By default, an execution fails if it violates performance thresholds (useful for validating software in CI/CD pipelines).
    • This can be disabled to allow executions to contribute to performance problem detection without failing.
  • SSL Issue Handling:
    • If an SSL certificate is expired, missing, or about to expire, the monitor can be set to fail.
    • This requires SSL expiration date verification to be enabled in monitor settings.
    • If multiple requests exist with different SSL expiration settings, each request’s individual setting is honored.

Triggering & Execution Behavior

  • Click Trigger Now to initiate execution. A summary dialog appears, listing execution locations.
  • The Execution stage starts as Triggered, and results update as they complete.
  • Any modifications to the monitor script (configuration) take effect immediately for on-demand executions.
  • Execution Timing Considerations:
    • Executions may start at different times for different locations.
    • Public locations may experience slight delays due to throttling, whereas private locations may begin sooner.

HTTP monitors reporting results page Elements 

  • Availability Section: Displays monitor uptime, downtime details, and affected locations. Outage duration excludes overlaps.
  • Availability Card: Shows overall availability, highlights global/local outages, and missing data.
  • Performance Monitoring: Tracks response times across requests and locations.
  • Performance Card: Displays trends in execution time, with shaded areas showing performance differences.
  • Performance Issues: Indicates ongoing (red) and closed (grey) problems, with a solid red line for threshold violations.
  • HTTP Request Breakdown: Displays detailed metrics (DNS lookup, TCP connect, TLS handshake, etc.) that contribute to response time.
  • Problem Detection and Analysis: Monitors for issues like global or local outages and performance violations.
  • Problems Section: Lists open/closed issues with details on affected entities and alerting profiles.
  • Problem Types: Defines global outages, local outages, and performance threshold violations.
  • Events Monitoring: Displays events contributing to monitor problems (active & resolved), with hover-over details.
  • Status Codes & Errors: Shows HTTP status codes over time and provides error details and an option to “Analyze errors.”
  • Custom failure messages: Set using api.fail() for detailed insights.
  • Notebook Integration: Includes predefined Dynatrace Query Language (DQL) queries for analyzing synthetic events in Grail.
  • Properties, Tags, and Services: Displays monitor details (steps, execution frequency, locations, and tags). If the endpoint is monitored by OneAgent, related services appear here.

FAQ

Dynatrace detects global outages, local outages, and performance issues through the Problems Section, where you can view open/closed issues, affected entities, and alert profiles.

The Status Codes & Errors section tracks request-specific HTTP responses over time and offers error analysis with a detailed “Analyze errors” option for deeper insights.

Yes, you can set custom failure messages using api.fail() to provide detailed insights for events and monitor problems.