Maintenance Windows

What are Maintenance Windows?

When your system undergoes planned maintenance activities that might cause service disruption, you don’t want to receive notifications that your services are down. Additionally, these periods shouldn’t be taken into account when monitoring the availability of your system. To avoid these situations, these periods can be excluded using maintenance windows.

Useful Links

Options

With maintenance windows, Dynatrace can identify periods of abnormal operation (downtimes, reduced performance periods, and high traffic events during load tests). Defining maintenance windows helps you to reduce alert spam and keep your baseline clean for accurate monitoring and alerting.

There are two types of Maintenance Windows.

  • Defined in advance
  • Excluded from SLA report calculation
  • Excluded from regular baseline calculation
  • Defined retrospectively or for an ongoing outage
  • Included to synthetic SLA report calculation
  • Excluded from regular baseline calculation

Setup and Configuration

Define a Maintenance Window

  1. Go to Manage > Settings > Maintenance windows > Monitoring, alerting and availability
  2. Select Add Maintenance window
  3. Provide a Name for the maintenance window
  4. Provide a Description of the purpose of the maintenance window
  5. Select Planned or Unplanned from the Maintenance type drop down
  6. From the Problem detection and alerting drop down, select the action that Dynatrace should take if a monitored component experiences a problem during the maintenance window
    • Detect problems and alert – Dynatrace will automatically detect and report all problems as it usually does and display a maintenance window icon next to each problem that was detected during the maintenance window.
    • Detect problems but don’t alert – Dynatrace will detect problems but won’t send out an alert. Problems will be listed on the problems page with a maintenance window icon.
    • Disable problem detection – Dynatrace will not detect problems and will not send out any alerts.
  7. Use the Disable synthetic monitors execution toggle to deactivate the synthetic monitors execution for all matching entities during the maintenance window
  8. For maintenance windows that recur on a schedule, use the Recurrence drop down to define daily, weekly or monthly (Choose once if there is no recurrence)
  9. Enter a Start and End Time
    • Select a timezone
    • For Eastern time, type “New_York” into the search bar and select America/New_York (Eastern Time)
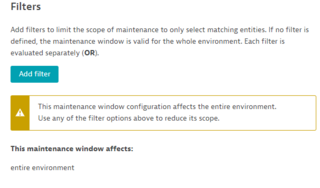
  10. Select Add filters to limit the scope of the maintenance window
    • You can enter an Entity type, a specific EntityTags or Management Zones
    • Under Entity, enter the entity type (this can be found in the URL of the entity here). Select the option that comes up
    • In Optional (ME Id) enter the name of the entity and select it from the dropdown
    • Each entity filter is evaluated independently
    • Each entity filter applies to a certain type of monitored entity and contains one or more tags
    • If multiple tags are specified, the entity must have all of them
  11. Select Save changes

MW Warning

WARNING: You MUST define filters!

If you do not define any filters, the entire Dynatrace environment will be put into maintenance mode.

Recommendation

Regarding step #10 above

When applying filters for which entities to be captured in your maintenance window, we recommend using the following tag:  RelatedMaintWindow: your maintenance window name. You must apply this tag to each entity and then apply it in the maintenance window logic. 

Defining the scope of a Maintenance Window (link is external)
MW Filter recommendation

Usage

Put a Host or Service in Maintenance Mode

There is a tag that can be applied to any host or service which will put them into maintenance mode, so that problem detection and alerts are silenced.

  1. Go to Infrastructure Hosts OR Applications & Microservices > Services
  2. Click on the host/service you want to edit
  3. Under Properties and tags, which is directly under the name of the host/service, click on more…
  4. Select Add tag
  5. Enter “MM_ON”
  6. To confirm that the host/service is in maintenance mode, select the host/service and you should see the Maintenance card on the right

Note:

  • Within 1-minute, Dynatrace will automatically apply an MM_ON_AUTO tag to the host/service and the processes on it
  • This works because the Full Silence maintenance window will find any entity with the MM_ON_AUTO tag and then disables problem detection and alerts

Take a Host/Service out of Maintenance Mode

  1. Select the host/service
  2. Under Properties and tags, click the “x” next to MM_ON

Note: Within 1-minute MM_ON_AUTO will go away and exit maintenance mode

FAQ

How will I know if a problem occurred during a maintenance window?

  • The problem will be flagged with a wrench and bolt icon to the left of its name
  • You can go to the problems page and filter by Context: Under maintenance to view a list of problems that occurred during maintenance windows