OS services monitoring

Dynatrace provides out-of-the-box availability monitoring for OS services, allowing you to track the status and performance of services running on monitored hosts. Depending on your monitoring mode, you can configure basic or advanced alerting to ensure high availability and proactive issue resolution.

screenshot of Dynatrace OS services monitoring

OS services monitoring

OS Services Alerting Options

Depending on your monitoring requirements, you can choose between basic or advanced alerting for OS services.

  • Discovery mode: Supports only basic alerting.
  • Full-Stack & Infrastructure monitoring modes: Support both basic and advanced alerting.

Basic Alerting

  • Provides insight into service status.
  • Monitors an OS service’s current state.
  • Triggers an alert when the service changes from running to failed.

Advanced Alerting

  • Provides access to service status and availability metrics.
  • Tracks service availability per minute for more detailed insights.
  • Enables complex alerting logic, such as notifying if a service remains stopped for more than 10 minutes.
  • Allows creation of custom alerting rules to trigger alerts based on service availability.
os-service-status-dashboard-example-light-919-5bd9bbe242

Service status (Basic alerting)

fetch `dt.entity.os:service` | fieldsAdd status

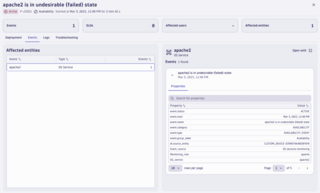
If the alert is enabled, events and problems are created when a service status changes, such as when a service goes from running to failed. For more details, refer to Host availability.

os-service-failed-1486-77d0ea5343

Failed service alert

screenshot of os-service-availability-dashboard-example-light-1148-5dde972c54

Service Availability Metric (Advanced Alerting)

The service availability metric provides detailed, per-minute insights into your OS service status. This enables:

  • Real-time monitoring of service availability.
  • Granular alerting rules, such as triggering an alert only if a service remains failed for more than 10 minutes.
  • Better control over service health tracking, reducing unnecessary alerts.
     
timeseries count(dt.osservice.availability),by:{dt.osservice.display_name, dt.osservice.status} | filter dt.osservice.display_name=="apache2"

Monitor a service

To monitor an OS service, perform the following steps.

Dynatrace allows you to configure OS services monitoring at different levels, each with a specific priority:

  1. Host Level (Highest priority)
  2. Host-Group Level
  3. Environment Level (Lowest priority)

1. Host Level (Overrides host-group and environment settings)

To configure OS services monitoring at the host level:

  1. Go to Hosts or Hosts Classic in Dynatrace.
  2. Find and select your host to open the host overview page.
  3. In the upper-right corner, click More (…) > Settings.
  4. In the host settings, select OS services monitoring.

2. Host-Group Level

To configure OS services monitoring at the host-group level:

  1. Go to Deployment Status and select OneAgents.
  2. On the OneAgent deployment page, turn off Show new OneAgent deployments.
  3. Filter the table by Host group and select the host group you want to configure.
    • Note: The “Host group” property is not displayed if the selected host does not belong to any host group.
  4. The OneAgent deployment page will now be filtered by the selected host group.
  5. Click the host group name in any row to open its settings.
  6. In the host group settings, select OS services monitoring.

3. Environment Level

To configure OS services monitoring at the environment level:

  1. Go to Settings in Dynatrace.
  2. Navigate to Collect and Capture > Infrastructure > OS > OS services monitoring.

Each level of configuration overrides the lower levels, ensuring precise control over OS service monitoring across individual hosts, host groups, or the entire environment.

A Service Monitoring Policy defines how Dynatrace monitors an OS service based on its state and specified rules. By default, Dynatrace includes:

  • Auto-start Windows OS Services policy
  • Auto-start Linux OS Services policy

These policies monitor auto-started services that have a failed status.

Understanding Policy Order

The order of policies is important:

  • Policies higher in the list are processed first.
  • If a higher policy is fulfilled, lower ones will not be applied.
  • This allows for selective alerting with minimal policies.

Example:
If you want to monitor all auto-started services (not just those from Microsoft), add a policy with disabled alerting that checks if the service manufacturer is Microsoft.

Steps to Add a Service Monitoring Policy

  1. Navigate to OS Services Monitoring
    • Configure the policy at the Host, Host-Group, or Environment level (refer to previous instructions).
    • Select Add policy to define a new monitoring policy.
  2. Define Policy Rules
    • System: Select your OS (Windows or Linux).
    • Rule Name: Enter a descriptive name (this appears in the Summary field).
    • Monitor:
      • Enable monitoring using the OS service availability metric (builtin:osservice.availability).
      • If enabled, Dynatrace will send the service status every 10 seconds (via dt.osservice.status).
      • Note: This metric consumes data points (refer to Metrics powered by Grail).
    • Alert: Enable if you want alerting for this policy.
  3. OneAgent Version 1.257+ Settings
    • Alert if service is not installed:
      • Enable this option if you want alerts for missing services on the host.
    • Service Status:
      • Define the service states that should trigger an alert.
      • Example (Windows & Linux):
        • running
        • stopped
        • start_pending
        • stop_pending
        • continue_pending
        • pause_pending
        • paused
  4. Using Logic Operations for Service Status Monitoring
    • Example Rules:
      • $eq(running): Triggers an alert if the service is running.
      • $not($eq(paused)): Triggers an alert for any state except paused.
      • $or($eq(paused),$eq(running)): Triggers an alert if the service is paused or running.
  5. (Optional) Alerting Delay (OneAgent 1.257+)
    • Define the delay (in 10-second cycles) before an alert is generated.
  6. Select Services to Monitor
    • Choose which services to monitor based on specific service properties.

Example Use Case: Alert if a Service is Stopped for More Than 1 Minute

  1. Add a new policy and name it Critical Service Monitoring.
  2. Enable monitoring using builtin:osservice.availability.
  3. Enable alerting.
  4. Set the service status condition: $eq(stopped).
  5. Set an alerting delay of 6 measurement cycles (since 1 cycle = 10s, 6 cycles = 60s).

This ensures an alert is only triggered if the service remains stopped for more than 1 minute.

Once you have added a service monitoring policy, you need to define which services to monitor by selecting OS Service properties or Host metadata.

Step 1: Add a New Rule

  1. Go to OS services monitoring (for the Host, Host-Group, or Environment level).
  2. Click Add Rule to define the services to monitor.
  3. (Optional) Select Rule Scope:
    • OS Service (default) – Monitors specific services based on properties.
    • Host – Monitors hosts based on metadata.

Step 2: Define Rule Scope

If You Select “Host” (OneAgent version 1.277+)

  • Use custom metadata to define which hosts to monitor.
  • Define matching conditions for host metadata using string expressions:

Examples of Host Metadata Matching (OneAgent 1.310+)

Condition Description
$match(ver*_1.2.?) Matches strings using wildcards (* = any characters, ? = one character).
$contains(production) Matches if “production” appears anywhere in the metadata value.
$eq(production) Matches if the metadata value is exactly “production”.
$prefix(production) Matches if the metadata starts with “production”.
$suffix(main) Matches if the metadata ends with “main”.
$not($eq(production)) Matches if the metadata is not “production”.
$and($prefix(production),$suffix(main)) Matches if the metadata starts with “production” and ends with “main”.
$or($prefix(production),$suffix(main)) Matches if the metadata starts with “production” or ends with “main”.

🔹 Note:

  • If your metadata contains special characters (e.g., brackets ( )), escape them with ~.
  • Example: $eq(my~(amazing~)property) matches my(amazing)property.

If You Select “OS Service”

Choose which services to monitor based on service properties.

Available Matching Properties (Windows & Linux)

Property Description
Display Name The name visible to system users.
Path to Binary The path of the service’s executable file.
Manufacturer The company or entity that created the service.
Service Name The system-recognized name or ID of the service.
Startup Type Defines whether the service starts automatically or manually.

Step 3: Define Matching Conditions

Use string expressions to match services.

Examples of Service Matching

Condition Example Matches Services That…
$prefix(ss) $prefix(ss) Start with “ss” (e.g., sshd).
$suffix(hd) $suffix(hd) End with “hd” (e.g., systemd-hd).
$eq(sshd) $eq(sshd) Are exactly “sshd”.
$contains(ssh) $contains(ssh) Contain “ssh” anywhere in the name.
$match(ip?tables*) $match(ip?tables*) Follow the pattern “ip?tables*” (e.g., iptables1, ip4tables).

Step 4: Combine Logic Operations (Advanced Matching)

You can combine multiple conditions using AND / OR / NOT operators:

Logic Operation Example Matches Services That…
$not($eq(sshd)) $not($eq(sshd)) Are NOT named “sshd”.
$and($prefix(ss),$suffix(hd)) $and($prefix(ss),$suffix(hd)) Start with “ss” and end with “hd”.
$or($prefix(ss),$suffix(hd)) $or($prefix(ss),$suffix(hd)) Start with “ss” or end with “hd”.

Step 5: Save and Apply

  1. Review your monitoring rules.
  2. Click Save to apply the configuration.
  3. Dynatrace will start monitoring the selected services.

If you are using OneAgent version 1.247+ and Dynatrace version 1.247+, you can add custom properties to your service monitoring policy. These properties allow you to define key-value pairs and customize event messages for better alerting and reporting.

Step 1: Add a Custom Property

  1. Go to OS services monitoring (at the Host, Host-Group, or Environment level).
  2. Select your monitoring policy or create a new policy.
  3. Click Add property to add a custom key-value property.
  4. Enter:
    • Key – The name of the property (e.g., "Business Impact").
    • Value – The value assigned to the property (e.g., "Critical").
  5. (Optional) Add multiple properties if needed.

Step 2: Customize the Event Details Message

  1. Locate the Custom message in the Event details section.
  2. Enter a custom message to appear in alerts.
    • Example:

      Service {{ServiceName}} on host {{HostName}} has been down for more than 10 minutes.

    • This message dynamically references monitored data using placeholders like:
      • {{ServiceName}} → The name of the OS service
      • {{HostName}} → The hostname of the affected server

Step 3: Save and Apply Changes

  1. Review your policy to ensure accuracy.
  2. Click Save changes to apply the policy.
  3. Dynatrace will now include custom properties and messages in alerts and events.

FAQ

1. How do I manage OS services monitoring in Dynatrace?

You can manage OS services monitoring at three levels: Host, Host-Group, or Environment.

2. How do I manage OS services monitoring at the Host level?

  1. Go to Hosts or Hosts Classic (latest Dynatrace).
  2. Find and select your host to open its overview page.
  3. In the upper-right corner, select More (…) > Settings.
  4. In the Host settings, go to OS services monitoring.

3. How do I manage OS services monitoring at the Host-Group level?

  1. Go to Deployment Status and select OneAgents.
  2. On the OneAgent deployment page, turn off Show new OneAgent deployments.
  3. Filter the table by Host group and select the host group you want to configure.
  4. Select the host group name in any row to open its settings.
  5. In the Host-group settings, select OS services monitoring.

4. How do I manage OS services monitoring at the Environment level?

  1. Go to Settings > Monitoring > OS services monitoring.
  2. The monitored OS services will be listed in a table under the Add policy button.

How do I stop monitoring an OS service?

  • In the OS services monitoring table, turn Enabled off for the service.

 How do I delete an OS service from monitoring?

  • Select the Delete button in the Delete column of the OS services table.

How do I view and edit details of a monitored OS service?

  • Click the expand control in the Details column to view and edit service settings.

You can use the Settings API to configure your service availability monitoring at scale.

  1. To learn the schema, use GET a schema with builtin:os-services-monitoring as the schemaId.
  2. Based on the builtin:os-services-monitoring schema, create your configuration object.
  3. To create your configuration, use POST an object.