Navigate the Dynatrace platform
The Dock is your starting point in Dynatrace, serving as an expandable/collapsible panel on the left side of the display. It acts as your tool belt, allowing you to pin and access frequently used applications easily.
With the Dock, you can:
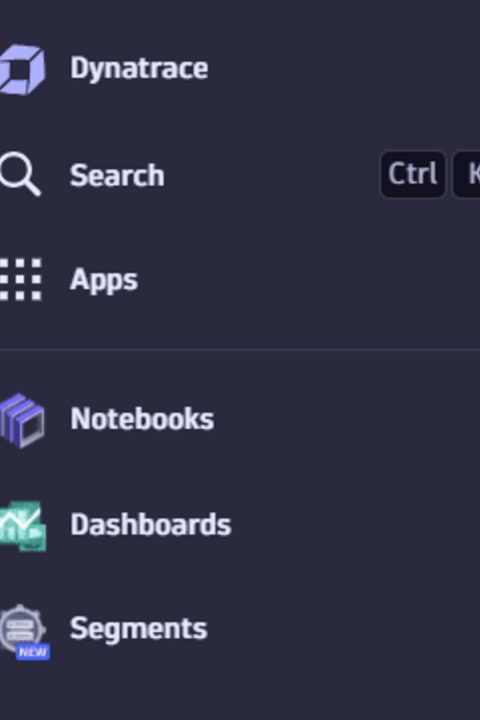
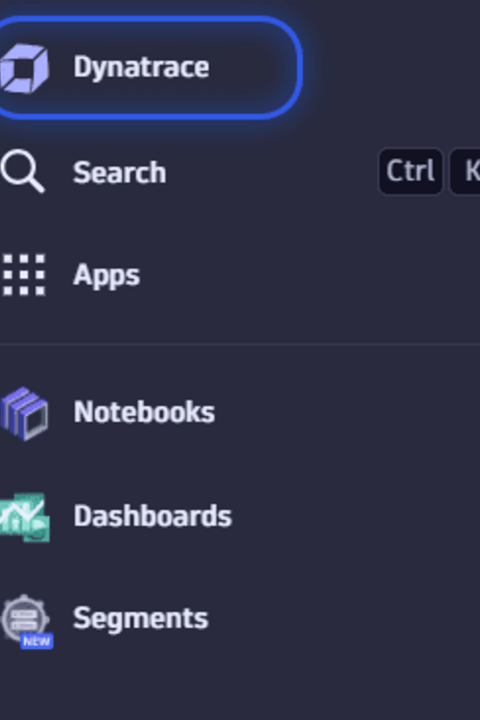
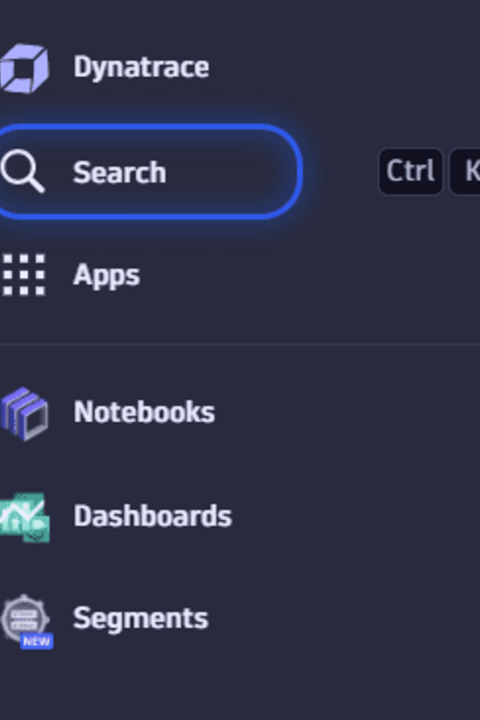
If the Dock is collapsed, only the search icon will be visible. You can quickly open Search using the keyboard shortcut CTRL+K (Windows) or CMD+K (Mac). Dynatrace platform search includes customizable options and filters to refine your results. For more details on advanced search features, refer to Platform search.
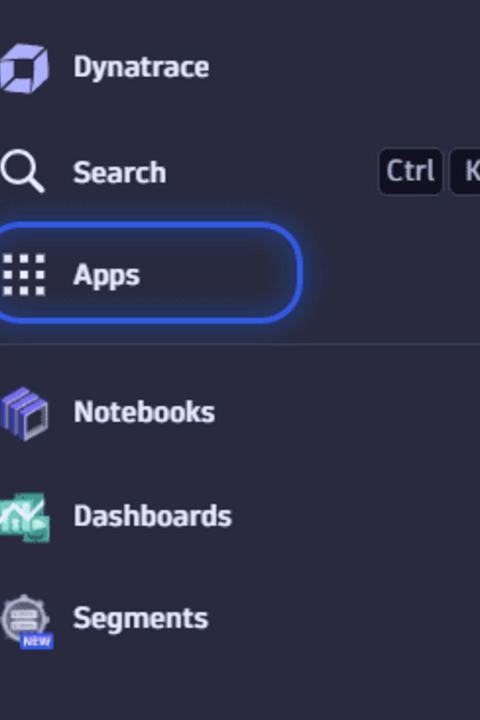
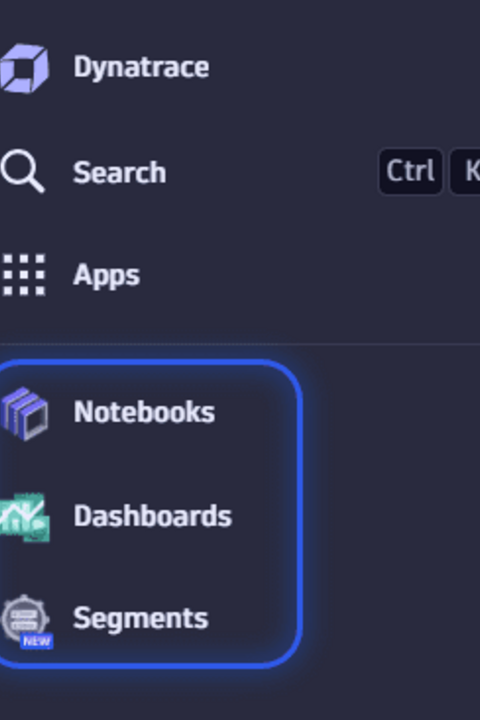
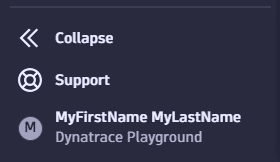
<< Collapse hides the labels, showing only a narrow column of icons, which frees up screen space for displaying your data. If you frequently use certain apps and functions, the icons alone may be sufficient for quick navigation.
>> Expand restores the full Dock, making labels visible again for easier readability.
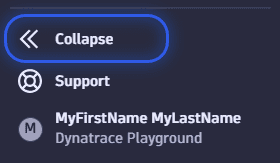
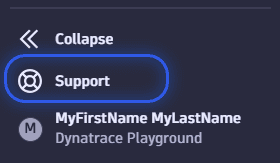
To open the user menu, select your name in the lower-left corner, at the bottom of the Dock.
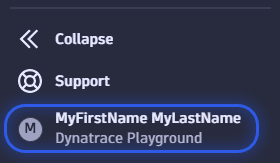
If you prefer the Classic UI or are having trouble navigating the New UI, you can easily switch back.
Steps:
This option allows users to return to the familiar Classic UI experience, even while exploring the New UI features.

Quick tour of the new UI layout, key features, and how to navigate it easily.
To access, click on the Dashboards icon in the Dock or use the search bar (CTRL+K or CMD+K) to type “Dashboards” This is where DQL (Dynatrace Query Language) is used for advanced data exploration and analysis.
Optionally, you can Pin it to the Pinned and Active Apps section in the Dock for quick access. This ensures that your frequently used apps remain easily accessible without needing to search for them each time. Simply hover over the app in the Dock and select Pin Icon to keep it in the pinned section.
Infrastructure & Operations – To get to the new host page, select Infrastructure from the main navigation menu, and then choose Hosts or search for “Infrastructure & Operations” in the search bar.
Optionally, you can Pin it to the Pinned and Active Apps section in the Dock for quick access. This ensures that your frequently used apps remain easily accessible without needing to search for them each time. Simply hover over the app in the Dock and select Pin Icon to keep it in the pinned section.
Problems – Click on the Problems icon in the navigation menu or use the search bar to type “Problems.” This section displays detected issues, enabling you to analyze root causes and track incidents in real time.
Optionally, you can Pin it to the Pinned and Active Apps section in the Dock for quick access. This ensures that your frequently used apps remain easily accessible without needing to search for them each time. Simply hover over the app in the Dock and select Pin Icon to keep it in the pinned section.
Access Synthetics by selecting the Synthetic Monitoring option in the navigation menu or by searching for “Synthetics” using the search bar.
Optionally, you can Pin it to the Pinned and Active Apps section in the Dock for quick access. This ensures that your frequently used apps remain easily accessible without needing to search for them each time. Simply hover over the app in the Dock and select Pin Icon to keep it in the pinned section.
To reach Settings Classic, use the search bar to type “Settings Classic” and select the relevant result.
Optionally, you can Pin it to the Pinned and Active Apps section in the Dock for quick access. This ensures that your frequently used apps remain easily accessible without needing to search for them each time. Simply hover over the app in the Dock and select Pin Icon to keep it in the pinned section.