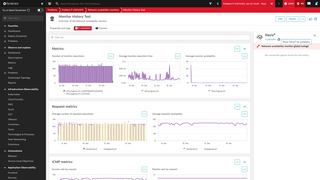
NAM Setup: How It Works
NAM monitors are designed to support more than one step within the monitor setup. Each step can contain multiple requests, and they are executed sequentially. However, within a single step, multiple requests can run in parallel, ensuring that the failure of one request doesn’t affect others.
For instance, you might monitor a group of four hosts using ICMP checks. You can either create separate tests for each host or combine them into a single test with multiple requests. The latter method makes it easier to manage and configure, as you only need to update a single set of parameters, like frequency or location.
Creating a NAM Monitor in Dynatrace
To create a NAM monitor, follow these steps:
- Navigate to Synthetic Monitoring: Go to the Synthetic (new) section in Dynatrace and select Create monitor.
- Select Monitor Type: Choose Network monitor (NAM) from the available options.
- Configure General Settings:
- Name: Enter the name for the monitor (up to 500 characters).
- Protocol: Select the protocol (DNS, ICMP, or TCP).
- Description: Optionally, provide a description for your monitor.
- Tags: Optionally, add tags to classify the monitor. *Please add an Owner tag using the following format - Owner:first.last@yale,edu
- ServiceNow Integration Tags: Optional if you want alerts to create ServiceNow Incidents. Must include the following tags:
- [ITSM]AssignmentGroup
- [ITSM]BusinessService
- SupportLevel:9x5 or 24x7
- 9x5 creates P3, 24x7 creates P2
- Configure Requests:
- You can choose between Visual mode or Script mode for setting up requests.
- Define each request’s name, targets, execution attributes, and constraints.
- For ICMP, execution attributes might include timeouts, number of packets, data length, and time-to-live values.
- Set Frequency and Locations:
- Choose the frequency of execution (e.g., every 1 minute, 5 minutes, or 1 hour).
- Select one or more locations to run the monitor from.
- Configure Outage Handling:
- Optionally enable settings for generating alerts when the monitor is unavailable at all locations or only at specific locations.
- Review Summary and Save:
- After reviewing your settings, click Save to create the NAM monitor
Additional Settings and Customizations.
- Performance Thresholds: You can define performance thresholds for your requests, including RTT for ICMP, connection times for TCP, and resolution times for DNS. Violations of these thresholds will trigger alerts and problems.
- Target Filters: Use target filters to dynamically adjust your monitored hosts based on tags, host groups, or IP ranges. This is useful if the structure of your network changes.
- Outage Reporting: NAM monitors can also track outages, including the number of affected locations and total downtime. You can configure alerts based on the monitor’s availability and performance.
