Options/Features
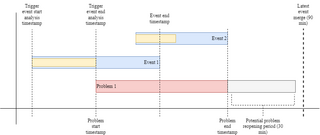
Dynatrace measures incoming traffic levels against defined thresholds to determine when a detected slowdown or error rate increase justifies the generation of a new problem event
Dynatrace uses two types of thresholds: Automated baselines and Built-in static thresholds
| Automated baselines | Built-in static thresholds |
|---|---|
| This multidimensional baselining automatically detects individual reference values that adapt over time. These values are then used to cope with dynamic changes within your application or service response times, error rates and load. | Built-in static thresholds used for all infrastructure events, which include instances such as high CPU, low disk space or low memory. This is a more straightforward approach with less of a learning period. |
After a problem has been detected, Dynatrace offers the impact analysis and the business impact analysis on the problems overview page, which allows you to analyze the consequences.
Recommendation
Dynatrace recommends letting Davis monitor your environment and automatically determine baselines for RUM and Service data
- Special cases (Key requests, SLA tracking, etc.) exist to give you complete control
- Keep Static Thresholds available for infrastructure entities so that they can be customized to fit your environment
Baseline or Static Threshold for anomaly detection?
Understand which key metrics fall under which threshold by default
- Automatic Baselines include Application and Service Layer metrics
- Built-in Static Thresholds include Process, Host, and Datacenter metrics
Follow the structure of the Smartscape (different entities are analyzed and mapped out). You have control to change these thresholds, but it is recommended to let Davis decide automated baselines
Setup and Configuration
Configuration
Metric breach configuration
Create a custom event:
- In the navigation menu, go to Manage > Settings > Anomaly detection > Metric events
- Select Add metric event
- Select the metric for your event
- Metric Key - enter name of metric
- Metric selector - enter query
- Select the type of aggregation
- Optional Add rule-based entity filters by clicking on Advanced entity settings and choosing an entity type from the drop down
- Define the Monitoring strategy
- Choose a strategy
- Auto-adaptive baseline – Dynatrace calculates threshold automatically
- Static threshold – threshold doesn’t change
- Fill in the settings for the strategy chosen
- Auto-adaptive – you’re deciding how many times the signal fluctuation is added to the baseline
- Static – you’re deciding the threshold value
- Then decide the sliding window for comparison – this defines how often the threshold must be violated within a certain time window to raise an event (The drop down allows you to decide Alert or Do not alert
- Select the timeframe of the preview. You can receive alerts for 12 hours, one day or seven days to see how effective your configuration is
- Select a title for the event
- Create a meaningful event message in the Event description
- Select Create custom event for alerting to save the event
For more information, see the following links: Auto-adaptive baselining for custom metric events | Dynatrace Documentation, Static thresholds for custom metric events | Dynatrace Documentation
Create an Alerting Profile
For this example, you will want to pay attention to step 5 - you will be using the event filter to define the event you just created. This tells the alerting profile to match on that specific event.
For further information on Alerting profiles, see Alerting Profiles
- Go to Settings > Alerting > Alerting profiles
- In the Create new alerting profile field, type a name for the new profile
- Define the management zone filter
- This causes the alerting profile to only evaluate data coming from the specified management zone
- The default is set to All, but a filter should be applied in most cases, which reduces the profile scope to the scope of your teams’ responsibility
- Management zones can overlap (multiple filters will be applied if a problem is detected on a service that is defined within multiple management zones)
- Define the severity-level rules
- You can specify up to 20 severity rules
- Rules are combined by the OR logic, so an event fulfilling any of the rules triggers a notification
- The following criteria can be used when applying filters:
- The severity level
- How long the problem is open before an alert is sent out
- (optional) Monitoring entities that have any/all of the specified tags are combined by the AND logic, so all of them must be fulfilled for the rule to be invoked
- Define the event filter
- Select Add event filter
- Select Custom from the dropdown
- Enter the Title of the custom event you just created
- Criteria can be inverted using the negate option (this turns begins with into does not begin with)
- Rules are combined by the following logic:
- Rules that contain negated criteria are grouped by the AND logic
- All other rules are grouped by the OR logic
- The two groups (negated and non-negated) are grouped by the AND logic
- Review the summary of criteria for the new alerting profile
- Select Save changes
Add a Problem Notification:
- Go to Manage > Settings > Integration > Problem notifications
- Define the Notification type from the dropdown
- Define the Display name of the notification
- In the Webhook URL bar, enter your webhook endpoint
- Decide whether you want to Accept any SSL certificate, and whether or not you want to Call webhook if new events merge into existing problems
- Add any custom HTTP headers you want to pass to your webhook
- Define the Alerting profile from the drop down
- This will be the alerting profile you just created in the previous step
- Select Send a test notification
Usage
Problem status
Dynatrace provides a Problems page which provides information all problems, whether open or closed.
- To get to the Problems page, click on the red box with a number in it in the upper-right hand corner
- This number indicated the number of problems that are currently open
- Alternatively, this page can be accessed by selecting Problems from the navigation menu. You can also find problems within individual entity pages.
- There are list options for filtering by Status, Severity, Impact level, and Maintenance
- You can also use the search bar for extra filtering options, such as tags, alerting profiles, and text
Opening a problem:
- Click on the blue title of any problem and it will bring you to the Problem overview page
- This page provides three helpful sections
- The top section provides the number of Applications, Services, and/or Infrastructure components that are affected by the problem
- The section on the left provides the Impact analysis, which includes details about the direct consequences of the problem
- This may also include the business impact
- The final section on the right provides the Root cause analysis, which includes details about the underlying root of the problem