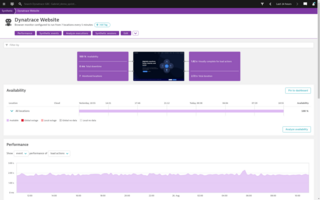
By default, monitors with open issues are listed alphabetically at the top of the table, followed by enabled monitors without issues, and lastly, disabled monitors, all sorted alphabetically.
You can customize the table view by sorting columns in ascending or descending order and selecting which columns to display or hide. Click Columns in the top-right corner to manage column visibility.
Pagination controls at the bottom of the table let you adjust the number of rows per page and navigate through different pages of monitors.
The columns display the following information for each monitor.
- Monitor name—Select to view a quick overview of the monitor to the right of the Synthetic monitors page
- Created—monitor creation date and time
- Last modified—ID of the user who last edited the monitor and the date and time of modification
- ID - full monitor identifier
- Last execution—date and time of the most recent execution from any location
- Type—monitor type, for example,
HTTP
- Frequency—execution frequency or
On demand, as specified in the monitor configuration
- Availability—average availability during the selected timeframe
- Duration—average performance during the selected timeframe in seconds
