Synthetics

Options

There are two types of Synthetic Monitors that can be created: Browser and HTTP.

Browser monitors HTTP Monitors (most basic)

Used to simulate user behavior in a real browser. It is a simulated user session driven by a modern web browser. You can either monitor a URL or record a sequence of clicks and user input that should be replayed during monitoring.

  • Used to click through a website and record the clicks, data entry, and navigation.
  • More costly than HTTP Monitor
  • This is more for validating navigation of a website or application functions
  • This is a click-and-script solution, you will need to download the chrome Dynatrace plugin so that it can record your session and create a script
  • Can use public or private locations

Used to Monitor APIs and health check end points. This monitor executes HTTP requests to monitor the availability and performance of HTTP endpoints. You can also chain multiple requests.

  • Can conduct the following HTTP Methods: GET, POST, PUT DELETE, HEAD, PATH, OPTIONS
  • Used to Ping a website to confirm you get an HTTP 200 or other HTTP response code
  • Used to validate API calls (you can pass in authentication and other header data; you can pass in JSON body)
  • Used to conduct basic SSL Certificate checks
  • Used to conduct pre- and post-processing with JavaScript against a website’s response
  • Used to check the response time of a website
  • Private locations only

Setup and Configuration

Installation

Create an HTTP Monitor:

  1. In Dynatrace, go to Synthetic > Create a synthetic monitor > Create an HTTP monitor
  2. Enter a name for the monitor (up to 500 characters)
  3. Select Add tag to apply manually created tags
    • Be sure to add an Owner tag (Key = Owner, Value = your email)
    • Tags can be managed after the monitor is created on the HTTP monitor details page
    • IMPORTANT: If the synthetic is under development, add tag “UnderDevelopment” to avoid problems
  4. Choose a mode
    • Visual mode (default) allows you to view and set up HTTP requests through UI controls
    • Script mode allows you to view and edit request settings as a JSON script
    • You can switch between the two as you set up your monitor
  5. Add HTTP request
    • Choose request type - Specify the request type and enter basic request settings
      • For an HTTP request: enter request URL, request Name (if default is insufficient), and select HTTP method. Then Add HTTP request to create the request
      • For OAuth2 authorization request: enter the Access token URL and give the request a Name (if default is insufficient). Then Add OAuth2 authorization request to create the request
    • Once the request is created, configure basic request settings in the expanded request settings. This is where there is an optional User agent and the ability to specify success/failure based on Response status code verification.
      • Expanded request settings is where you can add token credentials to the HTTP request URL
    • Configure Additional options for the request (vary based on request type)
  6. Add multiple HTTP requests if needed: select Add HTTP request again and repeat the steps above
  7. Select Next in the lower-left corner to specify monitor frequency and locations
  8. Choose monitor frequency. Scroll down to select locations (private and public locations are displayed by continent).  Selections will be displayed on map.
  9. Select Next for a final review of monitor settings
  10. On the Summary page, review the properties of the HTTP monitor
    • Then select Create HTTP monitor to save changes and activate the monitor

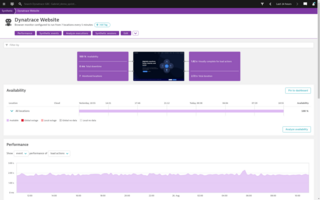
The HTTP monitor details page will be displayed and will begin showing results data as it’s acquired. From the quick links in the upper-left corner, select the expand button to access monitor settings.
Update an Existing HTTP Monitor:

HTTP monitors can be configured during set up (see above section Create an HTTP monitor)

To configure an existing HTTP monitor:

  1. Select Synthetic from the navigation menu
  2. Click on the HTTP monitor you want to configure (you’ll be taken to the details page)
  3. Select the expand button, then click on Edit from the quick links
    • If you’re using the older version, select the Browse button (…) then Edit
  4. Look through the Monitor settings tabs on the left to configure settings (click on each section below for more information)
  5. When you are finished making changes, you can Discard changes or Save changes in the lower-left corner

Configure Browser Monitors:

Browser monitors can be configured during set up (see previous section Create a single-URL browser monitor)

To configure an existing browser monitor:

  1. Select Synthetic from the navigation menu
  2. Click on the browser monitor you want to configure
  3. Select the Browse button (…) in the upper-right corner, then select Edit
  4. Look through the Monitor settings tabs on the left to configure settings (click on each section below for more information)
  5. When you are finished making changes, you can Discard changes or Save changes at the bottom right

Create a Single-url Browser Monitor:

  1. In Dynatrace, go to Synthetic > Create a synthetic monitor > Create a browser monitor
  2. Once on the Configure a browser monitor pagetype in the URL you want to monitor
    • Use the default Name or provide your own
  3. Select Add tag to apply manually created tags
    • Be sure to add an Owner tag (Key = Owner, Value = your email)
    • Tags can be managed after the monitor is created on the Synthetic details page
    • IMPORTANT: If the synthetic is under development, add tag “UnderDevelopment” to avoid problems
  4. Configure your monitor appropriately
    • Select the profile of your device, review additional options
  5. Next Select frequency and locations to continue, and choose your monitor locations a frequency
  6. Select View monitor summary in the lower-right corner
  7. On the Summary page, you can review and change the configuration by selecting Change URL or name or Change configuration written in blue)
  8. Click Create browser monitor
    • You’ll receive monitoring data within a few minutes

Create a Browser-clickpath Monitor:

Note: You must be using google chrome in order to set up this monitor. You must also install the Dynatrace Synthetic Recorder extension

  1. In Dynatrace, go to Synthetic > Create a synthetic monitor > Create a browser monitor
  2. Once on the Configure a browser monitor pagetype in the URL you want to monitor
    • Provide a Name different than the URL 
    • Department_Subdepartment_Environment
  3. Select Add tag to apply manually created tags
    • Be sure to add an Owner tag (Key = Owner, Value = your email)
    • Tags can be managed after the monitor is created on the Synthetic details page
    • IMPORTANT: If the synthetic is under development, add tag “UnderDevelopment” to avoid problems
  4. Configure your monitor appropriately
    • Select the profile of your device, review additional options
    • Record the browser clickpath by clicking on necessary steps
    • e.g. click on username, enter login credentials, etc.
  5. Next Select frequency and locations to continue, and choose your monitor locations a frequency
  6. Select View monitor summary in the lower-right corner
  7. On the Summary page, you can review and change the configuration by selecting Change URL or name or Change configuration written in blue)
  8. Click Create browser monitor
    • You’ll receive monitoring data within a few minutes

Usage

  1. In Dynatrace ITS tenant select Synthetic from navigation menu
  2. Use the Filtered by bar to search for monitors
  3. Use the menu on the left sidebar to filter by status, type, device profile, etc.
  4. Click on any monitor to get more information

FAQ

I can only access my site from inside Yale, how do I create a synthetic?

  • When you select a location, organize by ‘Type’ and select ‘Private’. There is only 1 and it is run from inside 25 Science Park.

I have to be on VPN to access my application because it’s behind a secure zone

  • This is still an outstanding issue because the internal Synthetic machine is not VPNd into the network for security reasons.  You would need to work with the EM Team to create a special machine with the VPN access to do this.  Enterprise Monitoring team is looking into additional solutions for this scenario.

I have to login to CAS to access the application

  • Dynatrace has the ability to capture the CAS login process.
  • Our standard is that if you need to enter credentials that you use the Dynatrace credentials vault to securely encrypt your login information.

I have to pass through DUO MF

  • Currently, request a Test SI account from InfoSec. This account would bypass DUO MF. Enterprise Monitoring is working with InfoSec to build a new standard SI type for Synthetics

I have to pass through MF other than DUO

  • Outside of DUO Yale has no control over the requirements.
  • Contact Enterprise Monitoring team so that we can discuss and try to develop a solution for you.