Custom Database Query Monitoring

What is Custom Database Query Monitoring?

Custom, self-made ActiveGate extensions allow you to run queries against the following databases:

  • Oracle
  • Microsoft SQL Server
  • MySQL
  • IBM DB2
  • PostgreSQL
  • SAP HANA
  • Snowflake
  • coming soon: Sybase, MariaDB, MongoDB, Teradata, IBM Informix

The results can be sent back to Dynatrace as metrics and logs.

Custom DB Query Example

Setup and Configuration

Configuration

  1. Contact the Enterprise Monitoring team through a ServiceNow form submission
    1. Be sure to provide a specific subject and description on what you want to monitor.
    2. Example:
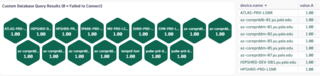
      1. Subject: Custom Database Query Monitoring Request 
      2. Description: Provide details on the database type, the query you would like to monitor, the server endpoint(s) and their ports, and how you would like to be alerted.

The Enterprise Monitoring team will then configure the extension, setup a metric event and alert.

Example - DBA Team

We have configured the extension for the database team to monitor whether or not the database can be reached. 1 = success, 0 = failure. Here are two dashboard tiles that portray the data, and turn red whenever a 0 is returned. There is also an alert to create a P2 ServiceNow ticket whenever these fail.

Custom DB Query Example 2